**Mark your calendars – The next Province Wide Count is February 12 – 16, 2018**
Completing the Picture: Mapping how Children fit into the transportation Landscape
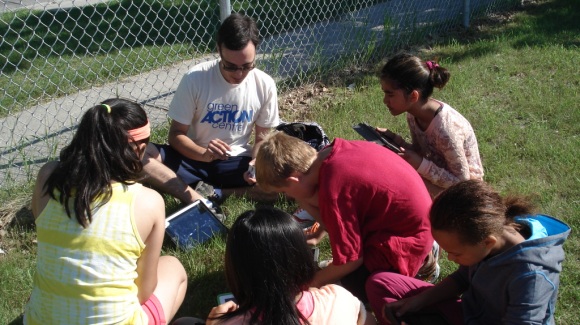
Our Active and Safe Routes to School Program is conducting a two-year study of Transportation Modes in Manitoba Schools.
 Thanks to funding from the Heart and Stroke Foundation, we are leading the first ever province wide count to learn more about how children are getting to school in Manitoba. Using our BikeWalkRoll software, teachers across the province will be conducting 30 second surveys for one week in February and May of 2016 and 2017. The data we generate will help move us forward as we make active transportation and healthy living a priority for children in Manitoba, and help everyone make better, healthier, and safer decisions. Stay tuned for the results!
![]()
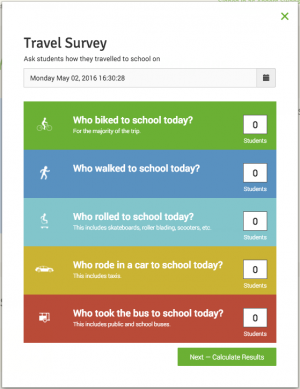
To complete a survey on BikeWalkRoll, simply ask the students in your class how they traveled to school, and record the various modes of transport. This can be conducted through a simple hands up survey, or any other method that you may find easier.
The five transports modes to record are:
1) Bike
2) Walk
3) Roll*
4) Car
5) Bus
*Wheelchairs, skateboards, scooters, and roller blades
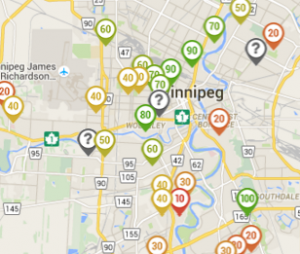
We recommend two options for inputting this data: 1) record the information from the survey on paper and input later, or 2) directly add the information into the app as you conduct the survey. Please note that the transport mode recorded should be the one employed for the majority of the trip. To enter your survey data, you can either hit the “Add a school” button or you can find your school on the map.
Enter the data by typing in the number of students who employed each travel mode into the corresponding mode. After all travel modes have been accounted for, select “Enter”, and watch as the site generates a score for your school. You can then compare this score to other schools in Winnipeg and across the world!
Here are some things to keep in mind when conducting your surveys:
- You have the option of completing a practice survey by selecting “Try a practice survey” on the website’s main page.
- “Who did you survey?” has a drop-down menu from which you are able to pick a grade or grades, and it allows you to select one or two grades per classroom. Teachers with combined classes of more than two grades will need to choose the grades that best reflect their class.
- Each classroom teacher will need to create an account in order to add their data to the survey. An e-mail confirmation will be submitted once an account has been created.
- This tool can be used to spark discussion about the importance of walking and biking to school for classes, so feel free to explore the site. It is currently being employed by schools across the world, so hop onto the site with your students, and compare your school’s score with others across the world. The site can be used anytime, so you can conduct a survey at any point-try and see how much you can improve your class score over time! Studies have shown that kids who walk or bike to school learn better, are physically and mentally healthier, are more independent, and demonstrate improved decision making. Schools with high rates of Active Transportation also see a reduction in vehicle congestion around the school, cleaner air due to less vehicles around the school, and less accidents and injuries. Active kids are healthy kids, and make for healthy schools and communities.
If you have any questions, concerns, or comments contact us at asrts@greenactioncentre.ca or 204.925.3774.


Recent Comments